The graphic below summarises the lifecycle of data returns for funding and regulation and identifies the main types of activity at each stage. Each activity is coloured according to whether the associated burden is fixed (red), or whether it varies (blue).
The model does not attempt to estimate the size of each activity; these will vary between data collections and between institutions.
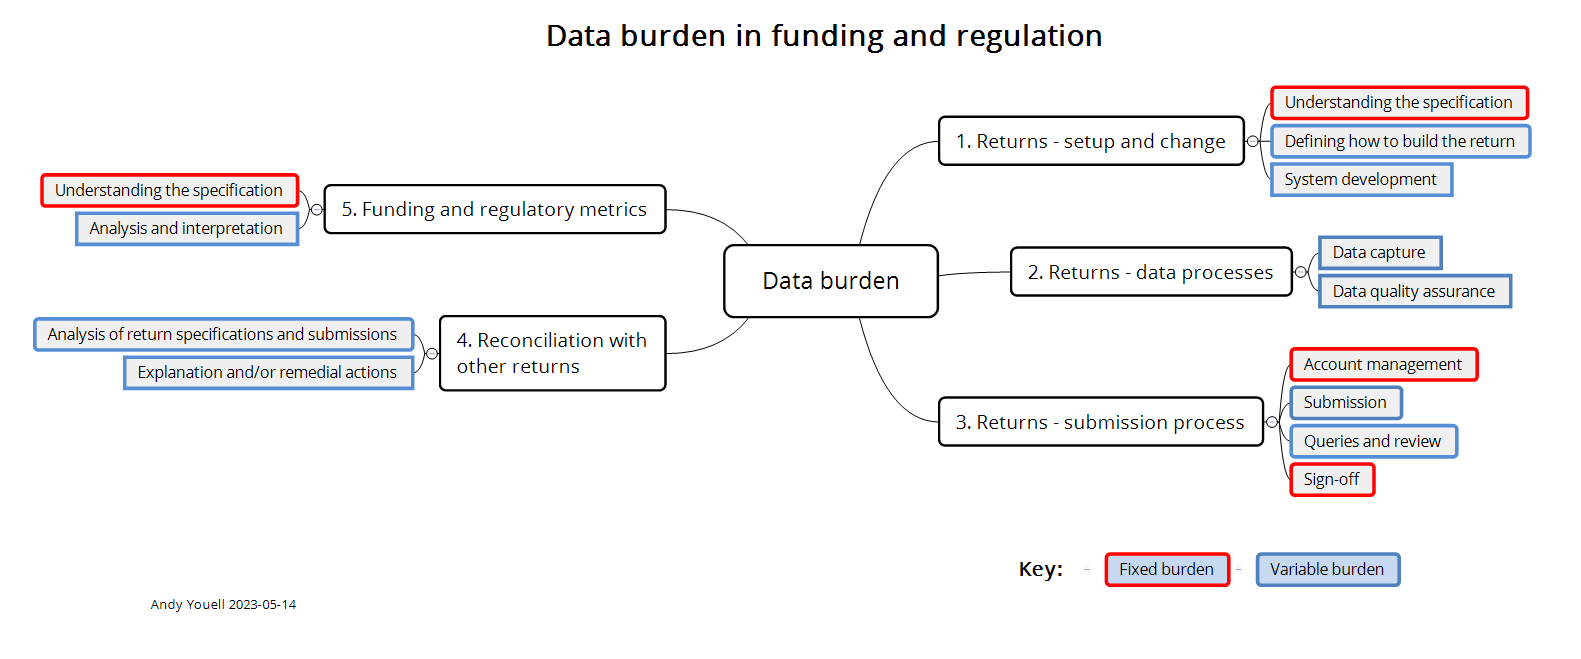
Click on the graphic to view a full-size version (opens in a new tab).